The Mondrian-esque composition above more than just resembles an abstract work of art. Its neat lines and symmetry belie grand ideas and microscopic details—in this case, of LEGO sets inspired by architecture.
The data visualization effectively color–codes kits from 2008 through 2020 to show hues present in models of landmarks like the Guggenheim Museum, as well as cityscapes such as Trafalgar square and Tokyo.
Design intern Jacopo Poletto dreamt up the idea in response to a special assignment. This spring, we’re hosting a course on data visualization in partnership with Feltrinelli education. We asked Jacopo to participate in a simulation and to try his hand at the final project: building a series of creative visualizations based on data pertaining to crime in the EU, financial literacy in Italy, or LEGOs.
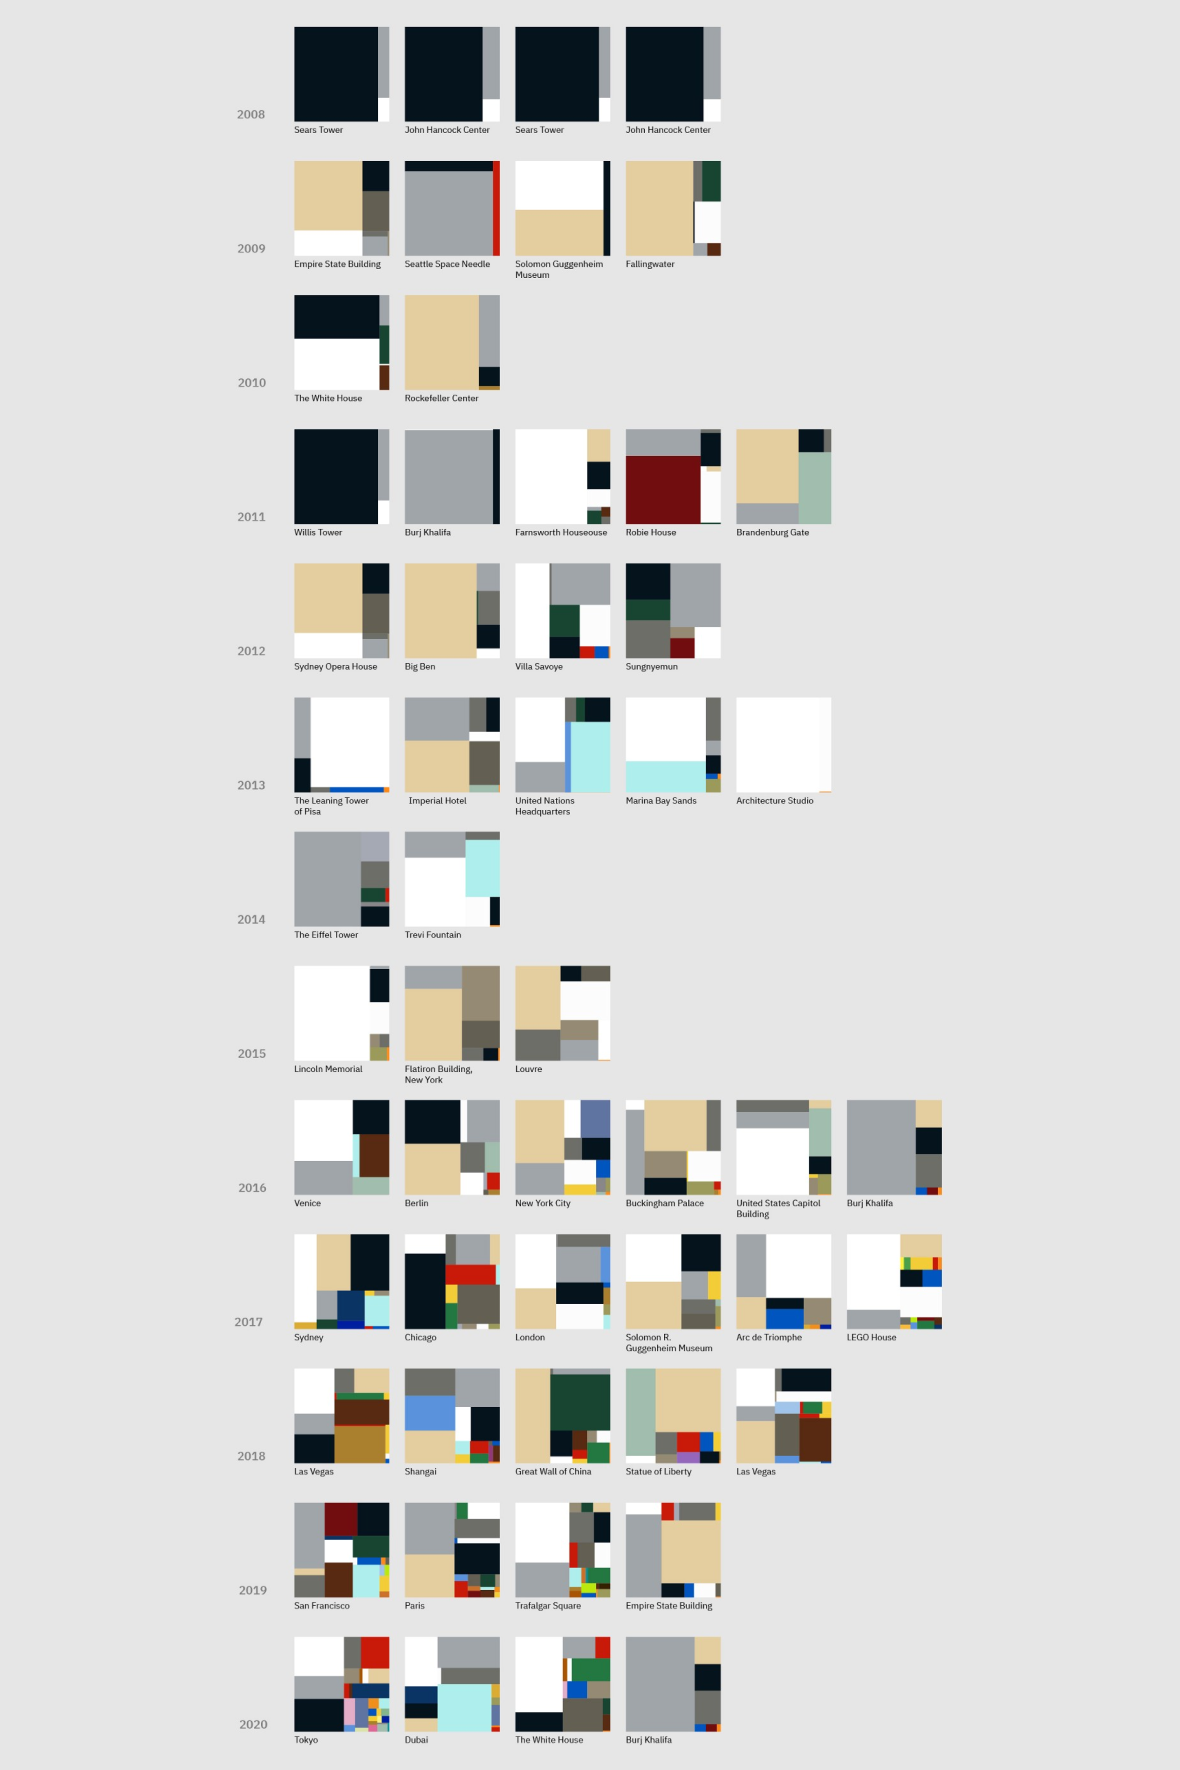
Jacopo’s treemap of LEGO Architecture’s output documents how brick colors have become more vibrant over time, mostly in correlation with the production of city replicas. The same observation holds true, however, when looking at two renditions of the same place. The treemap shows a White House model from 2010 that contained only five colors of bricks—black, white, grey, brown and green. In comparison, the 2020 version pops with new gradients of old hues, plus shades of blue, pink, and red.
In addition to chromatic diagrams, Jacopo also traced the valuation of sets over time in response to an intriguing fact from the prompt: “The values of some sets and minifigures have soared, in direct correlation with the popularity of secondary markets like eBay, Amazon ,and specialized LEGO sites like BrickLink and BrickSet.”
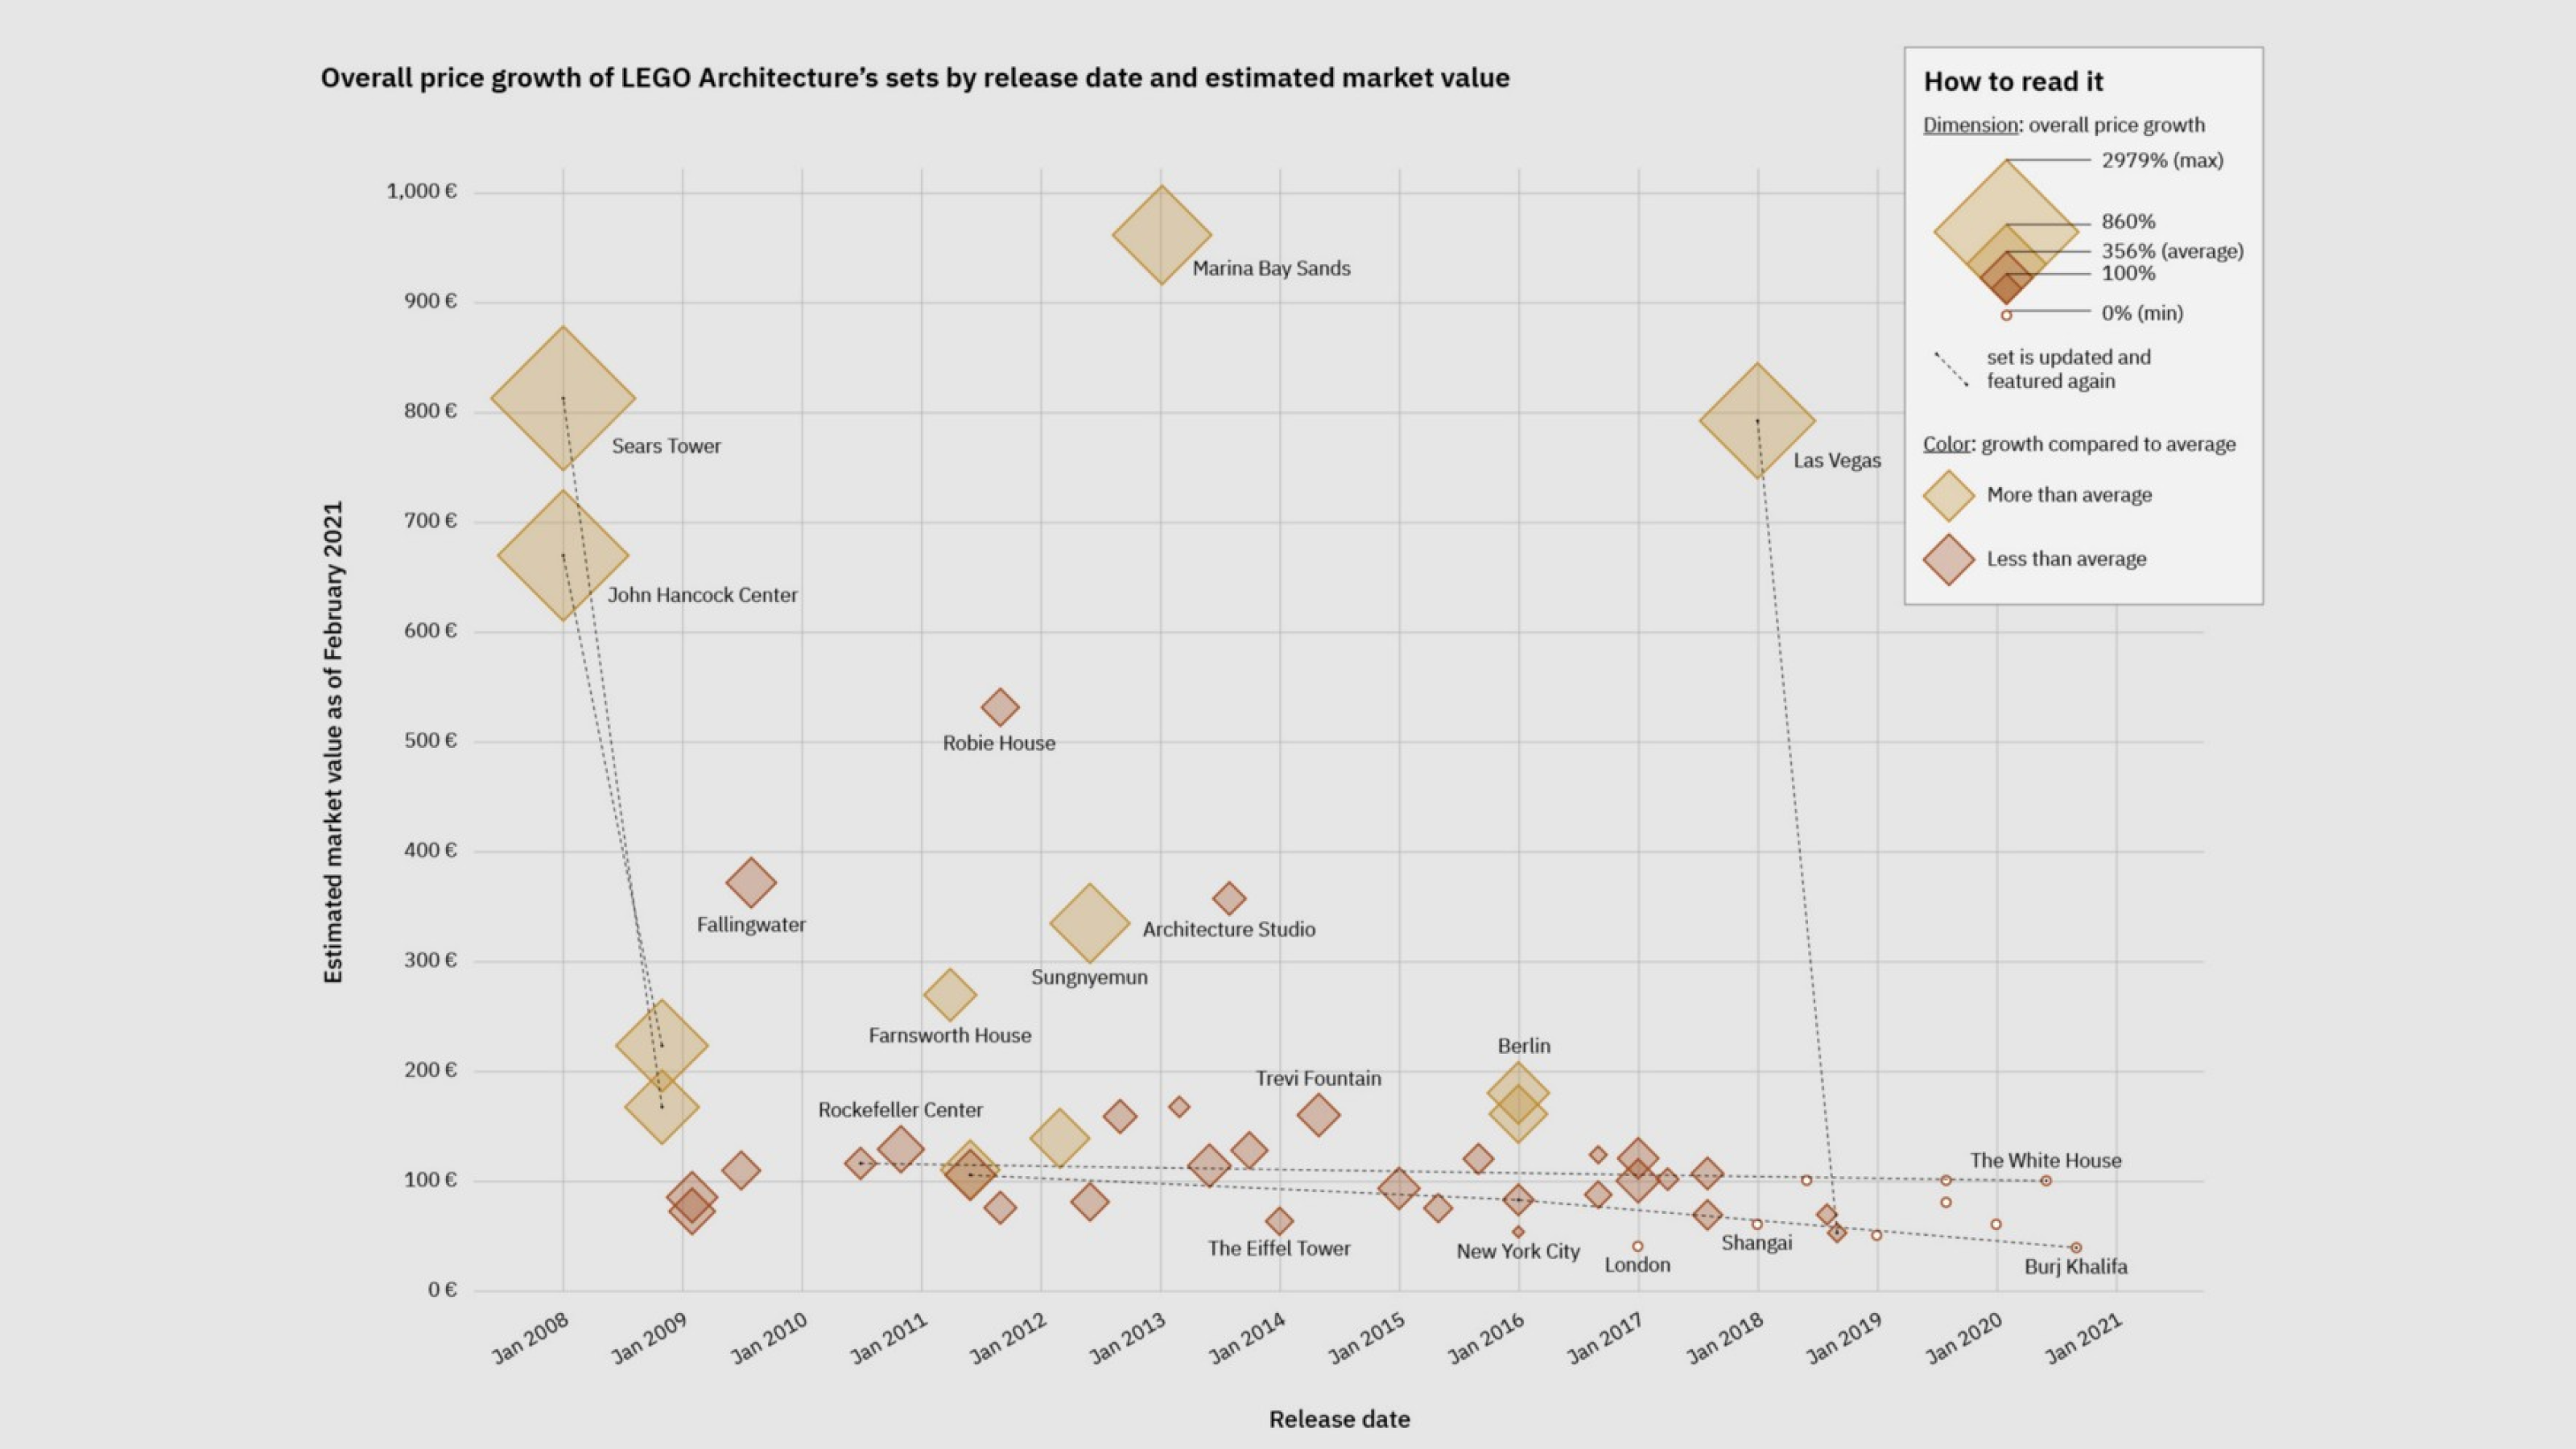
This visualization begs further exploration of a few models. Why, for example, are there two Las Vegas offerings from 2018? And why is one positioned in the 800 EUR range while the other is south of 100? The answer leads to a grim moment in history.
In light of the 2017 mass–shooting at the Mandalay Bay Hotel, the company pulled Las Vegas models from assembly lines to omit the site of the tragedy. An edited set was released with the Bellagio Hotel, but not before a few originals slipped into the resale market. Extremely rare, it’s the second–most expensive architecture set.
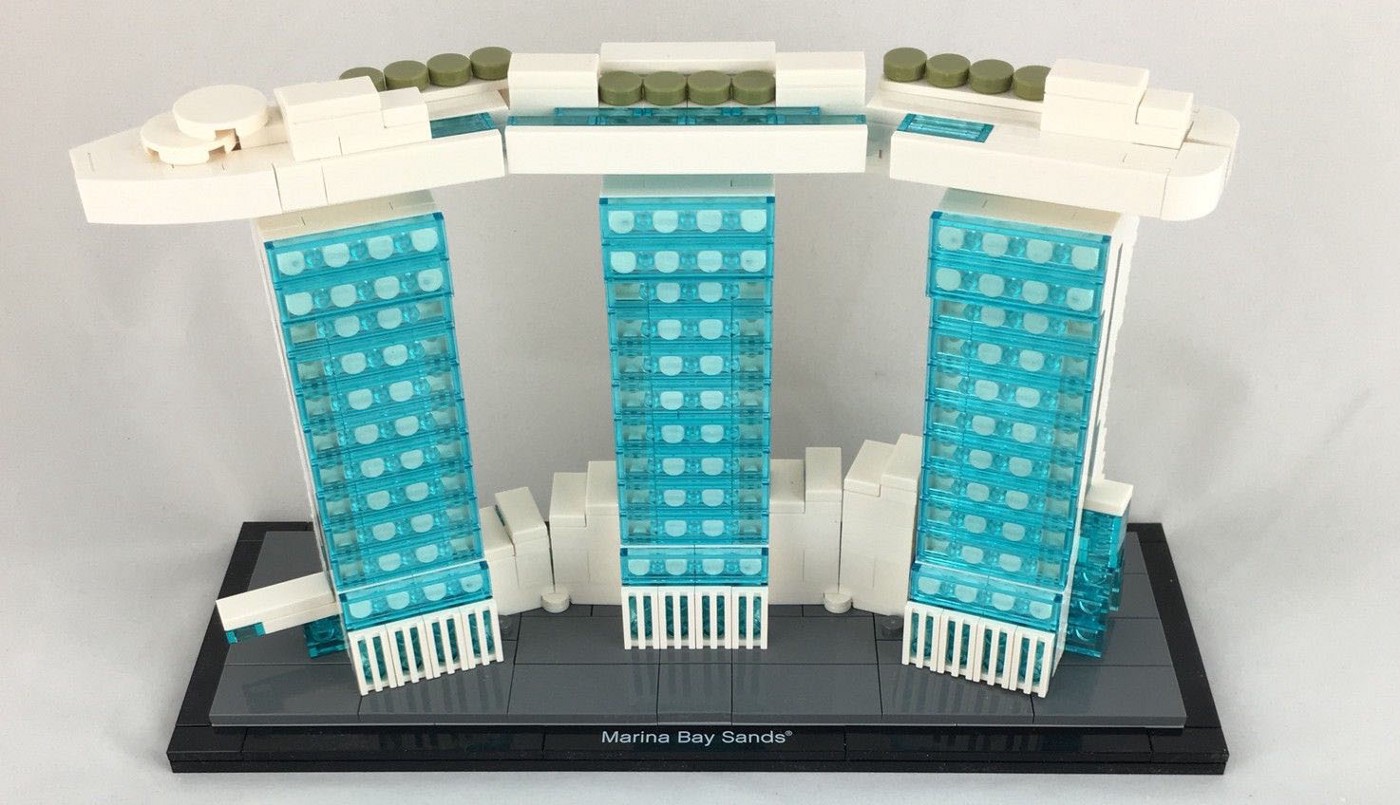
Positioned even higher on the chart is the Marina Bay Sands set, which has shot up in value by 2979%. According to Brick Economy, only 10,000 Marina Bay Sands kits were manufactured and sold in 2013, at the hotel’s gift shop and a handful of other locations in Asia.
These treemaps are an entry point to discover but a single segment of the wide world of LEGO collection. On the other hand, Jacopo’s chromatic dataviz offer eye–opening ways to study landmarks you may only think you know by heart.

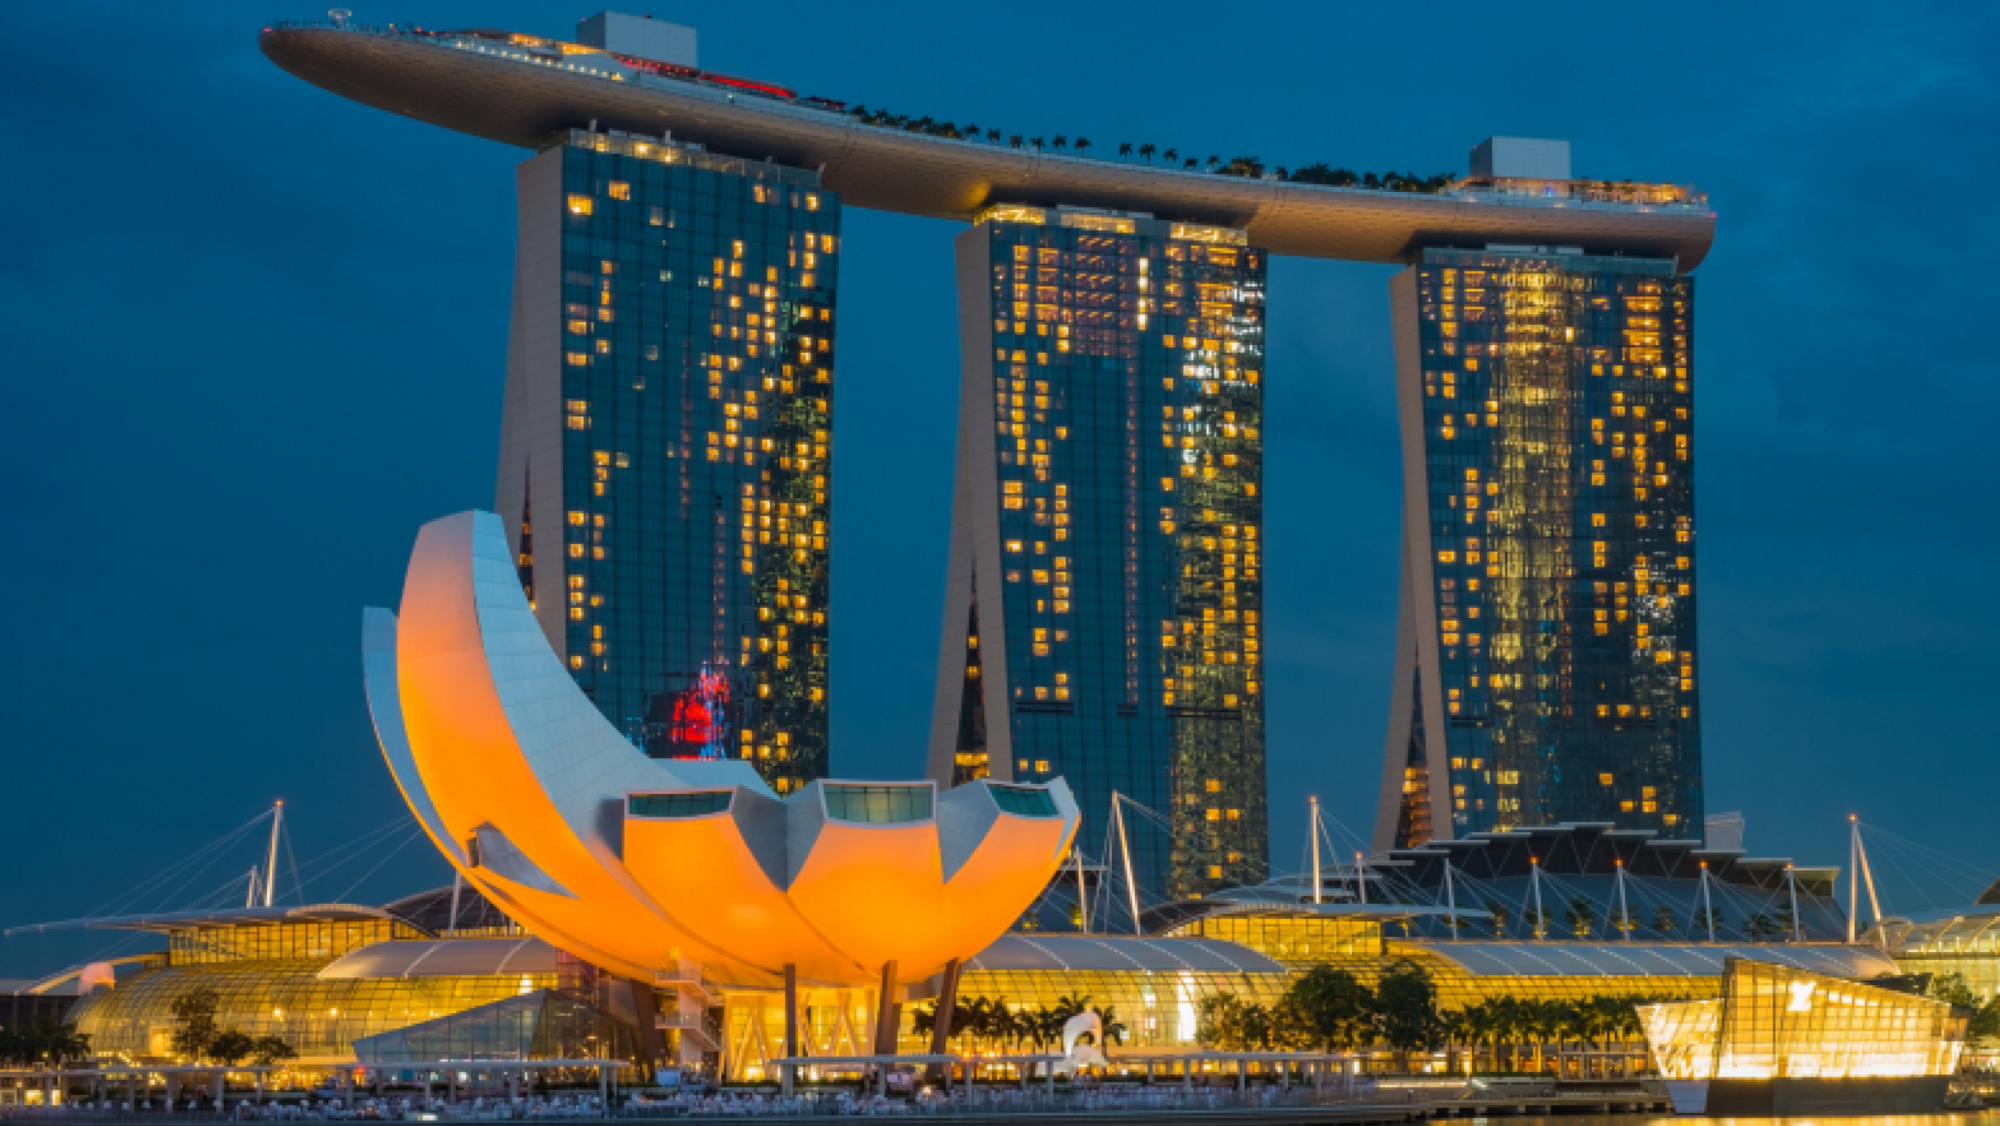
Take Marina Bay Sands, which is famous for its ocean hues. How does the color orange fit in? Let’s take a side–by–side look.

In this view, orange comes to the vivid forefront.
The visualizations impart how LEGO Architecture sets improbably recreate the multidimensionality of real world locations with attention to detail. Moreover, they demonstrate the potential of data visualization to render complexity with artful simplicity.